

Lainey Koval, Farm Business Management Specialist, Cornell PRO-DAIRY
In “Progress of the Dairy Farm Report 2025 (E.B. 2026-14)” authors Jason Karszes and Lainey Koval present a summary of New York dairy farm financial and business performance, marking the 70th year Cornell University has published a summary of New York dairy performance. More than 130 farms participated in the Dairy Farm Business Summary (DFBS) and Analysis Program in 2025, with this report focusing on 118 conventional dairy farms that completed the DFBS in both 2024 and 2025 and generated at least 85% of revenue from milk, dairy cattle and dairy calf income. Along with providing averages for the 118 farms, the report is also broken down into four herd size categories to provide additional comparison reports by group, along with a side-by-side comparison of group performance. Below are some highlights from the full publication.
Among the 118 farms, average herd size increased 6%, from 1,447 to 1,529 cows, while the cull rate, excluding animals sold for dairy declined to 30.6%. Milk sold per cow remained essentially unchanged at 27,293 pounds. Component production, however, continued to improve, with pounds of butterfat and protein sold per cow rising 3% from 2024. This was driven by the average percent butterfat increasing from 4.34% to 4.51%, and protein from 3.26% to 3.34%. On average, it was a poor crop year due to heavy rains in the spring followed by drought events experienced throughout much of the state. As a result, yield decreases were seen in both tons of hay dry matter and corn silage harvested per acre.
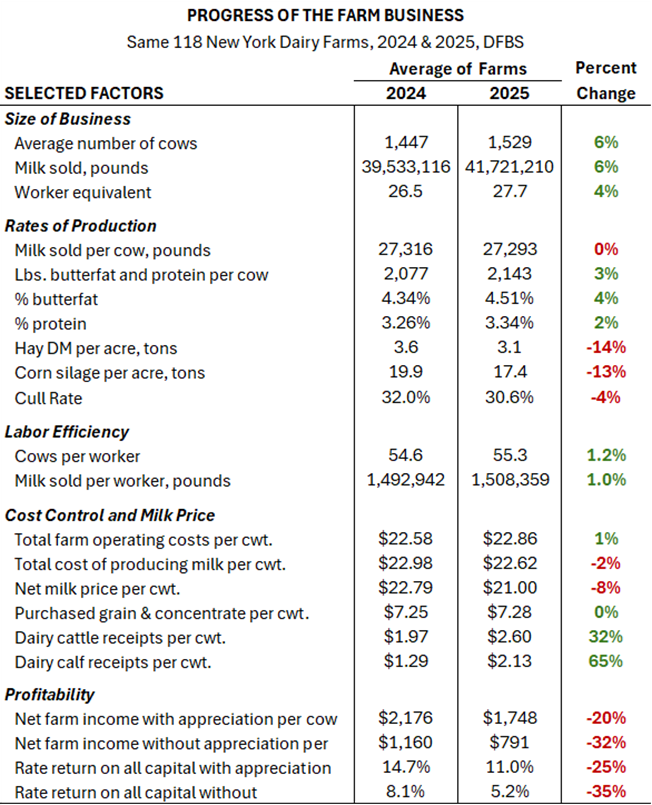
Net milk price decreased from $22.79 in 2024 to $21.00 per hundredweight (cwt.) on average in the 2025 year, an 8% decrease driven by lower prices paid for components in the second half of the year. With continued increases in cattle prices, dairy cattle receipts increased 32% from $1.97 to $2.60 per cwt. year over year. Dairy calf receipts also increased 65%, from $1.29 to $2.13 per cwt. The increased receipts for dairy cattle and calf of $1.47 per cwt. offset 82% of the decrease of $1.79 per cwt. in milk price during the year. Effects of the poor crop year were seen in the crop revenue category. With decreases in end of year inventory from the year prior, crop revenue decreased from $0.58 per cwt. in 2024 to $0.04 per cwt. in 2025.
Farm operating costs increased slightly to $22.86 per cwt., led by higher labor, fertilizer, and utility expenses. Labor costs rose 3%, fertilizer costs increased 13%, and utility costs increased 24%. Purchased grain and concentrate expense per cwt. was relatively unchanged from the year prior, up only 4 cents on average, at $7.28 per cwt. Offsetting some of these increases were lower fuel, milk marketing, crop spray, and interest expenses. Despite higher operating costs, the total cost of producing milk declined 2% to $22.62 per cwt. because non-milk revenue increased by 23%, reducing the portion of costs that needed to be covered by milk sales.
Overall profitability declined compared to 2024 due to lower milk prices and reduced crop inventories following a challenging crop year. Strong prices for beef and dairy cattle, however, provided additional revenue support during the year. Net farm income without appreciation averaged $791 per cow, down nearly $400 from 2024, while the rate of return on all capital without appreciation fell from 8.1% to 5.2%.
Trends across herd sizes can be seen on pages 10 and 11 of the full report. Moving from the smallest herd size group of less than 650 cows to the largest group of farms with over 2,000 cows, milk sold per cow and pounds of butterfat and protein per cow tended to increase. Percent components however, tended to be similar across the groups, with the second smallest herd size having the highest percent butterfat (4.54%) and highest gross milk price ($22.89 per cwt.). Labor efficiency measured in cows per worker and milk sold per worker also tended to increase as herd size increased, with the smallest and largest herd sizes averaging 44.1 and 57.0 cows per worker, respectively.
As herd size increased, the total cost of producing milk as well as investment per cow tended to decrease, and with that, rate of return on all capital tended to increase. The group of farms less than 650 cows had an average rate of return on all capital of 0.7%, while the group with greater than 2,000 cows averaged 6.4%. Although profitability tended to increase along with increases in herd size, there was a range in performance within each group, with farms at both ends of the spectrum in all herd size categories. Quintile ranges may be found in the included business charts by herd size in the full report.
The DFBS benchmarks and comparisons are provided for comparison purposes only and represent the performance of those farms participating the Dairy Farm Business Summary Program in New York State. These numbers do not represent the average for all dairy farms across NY and are from farms that are generally considered above average.
The full 2025 Progress of the Dairy Farm publication and data tables may be found on the Cornell CALS PRO-DAIRY website, at https://cals.cornell.edu/pro-dairy/our-expertise/business.